The new website launch went…?
It is hard for us to believe that already one year has gone by since we launched the new Async Labs website. We worked on our website for almost four months and invested in it 1162 hours (honestly – probably even more).
We quietly launched a new website in October 2020. Our main goal was “It must be better than our previous website”. You must have been asking, better in which way?
In every possible way. We have analyzed trends, our competitors, checked our capacities and started. You would be surprised how hard it is to find available developers and designers in your own company for the intern project.
This time we were doing it for our main client – ourselves. We had even greater pressure as this work represents the whole Async Labs team, and clients and future employees will closely check it.
With the new website launch, we had three main focuses:
- Separate Marketing vs. Development vs. Design
- Achieve 2,5 million Impressions on Google by the end of 2021
- Generate more Leads; Increase by 50% in Pipedrive database
How we separated services Marketing vs. Development vs. Design?
As an agency, we stand out on the market as a software development agency whose core business is custom software development products, from application development, through mobile iOS and Android apps development.
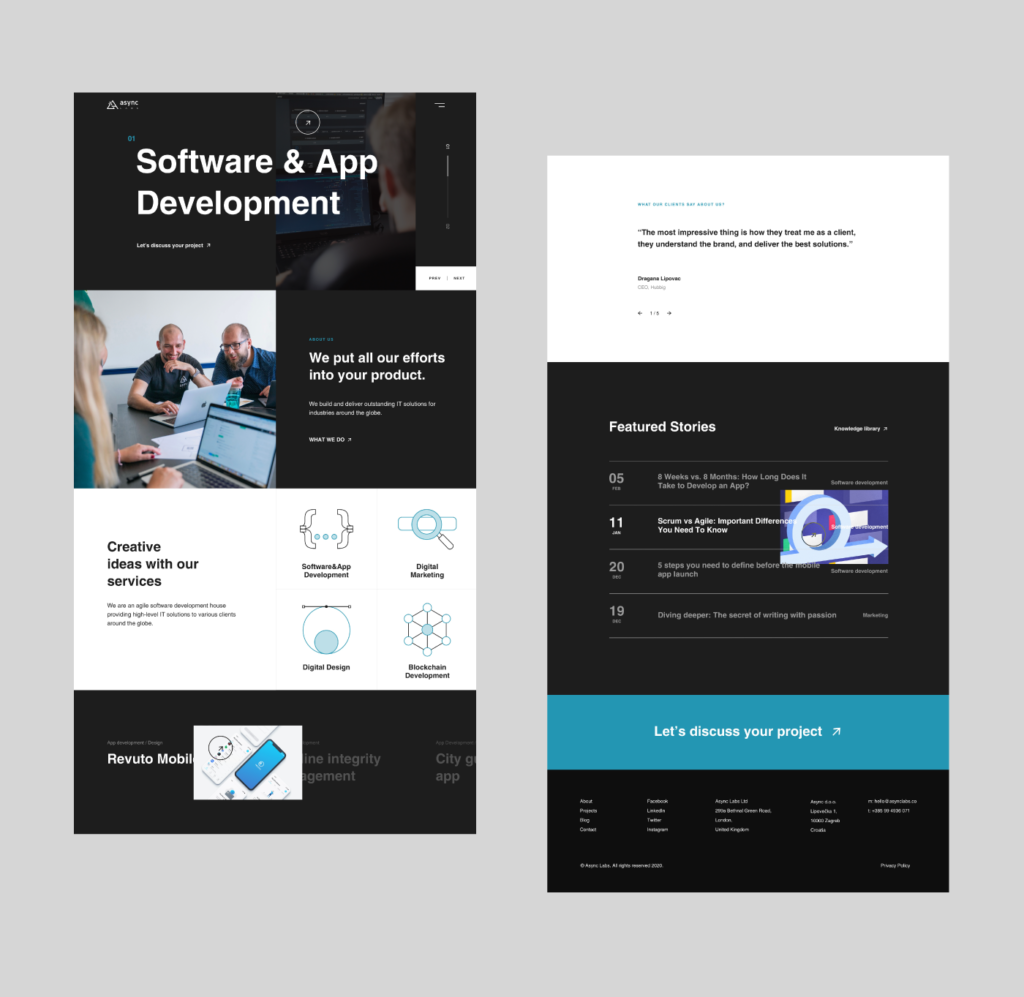
With the new website launch, one of the goals was to clarify that our agency services, besides software and app development, are UX and UI design and digital marketing.
Along with that comes a better sitemap, which is essential for SEO and makes it easy to navigate and crawl through the website.
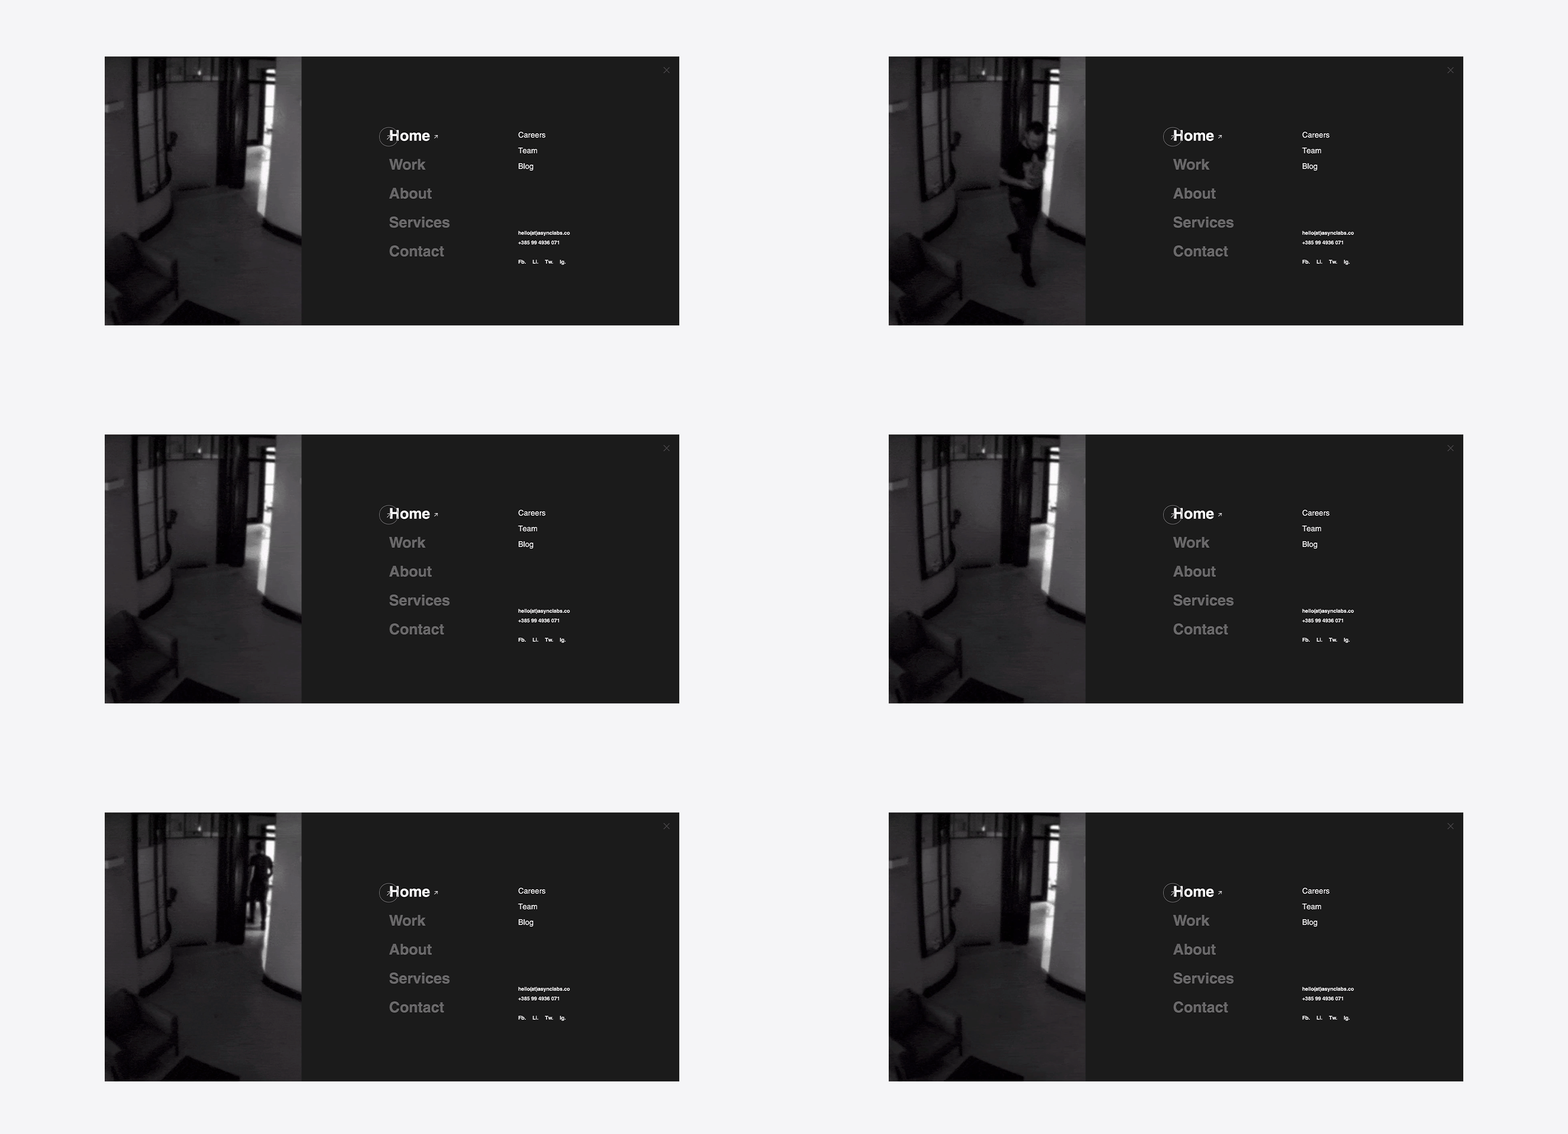
On our homepage now is a slider on which three main services are shown to website visitors. Furthermore, every service has its subpage.
For example, a digital marketing service has its own page. After clicking on some services from digital marketing we offer, we again have a subpage of this particular service. This helps us a lot for SEO, advertising, and remarketing campaigns, as we can target people based on their activities through the website and the final location where they have landed.
Moreover, on our Work page are written stories behind some projects we have done. In our case studies, we have four chapters: a short intro about the client; a challenge we need to solve; a solution of what we did; what we have as a result.
The most important thing here is that Work pages are also separated by the service Digital Design, Digital Marketing, or Software Development, depending on what we have done in each project. It is now easy to navigate for end-users and find what they are looking for.
In addition to this goal on our Blog, articles that are written are also tagged by our main services, but we will discuss it in the following paragraph.
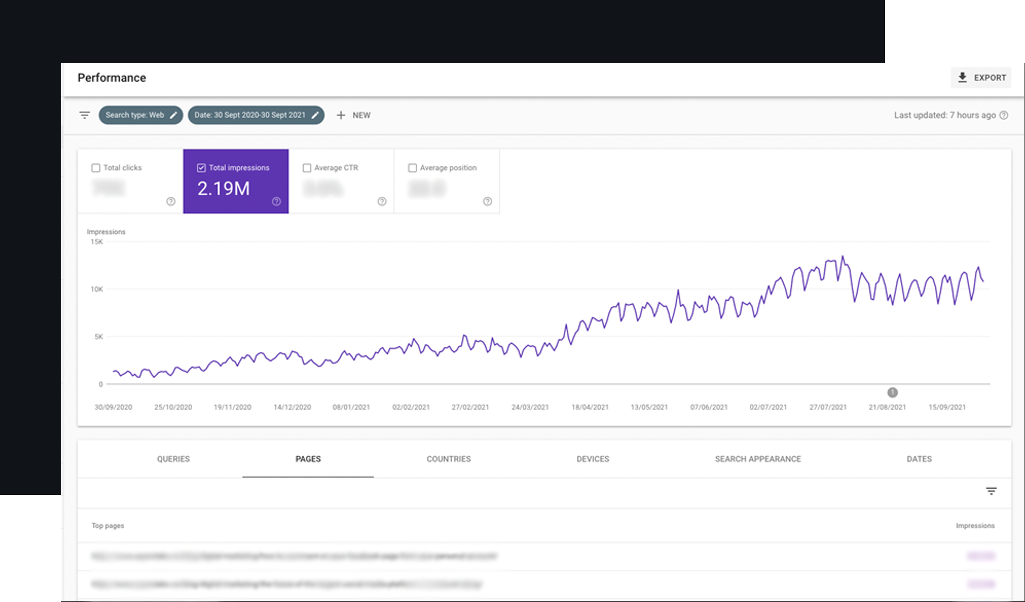
Impressions increased by 159% and generated 2,19 million in a year
In the last 12 months (we have been watching the period from 30 September 2020 – 30 September 2021), we have generated 2,19M impressions on Google, according to Google Search Console.
In September 2021, we had 317 000 Impressions. If we compare this data to September 2020, where we had 49 900 Impressions, this is an increase of 535.27%.
If we look at the previous 12 months, September 2019 – September 2020, we had 844 000 Impressions. Compared to September 2020 – September 2021, this is an increase of 159.48%.
We have been continuously and for years working on our SEO. In this case, we are focusing on writing SEO-optimized content on our website. We are also giving special attention to our Blog post section, which we mentioned before.
Increase in Page Views by 221.59%, from 47,807 to 153,744
We have published 32 blog articles with custom-made visuals and 46 966 written words in just one year.
From September 2019 to September 2020, we had 47,807 Page Views. After the new website launch, from September 2020 to September 2021, we have 153,744 Page Views.
How did we manage it? With our Content strategy, we have focused on the following:
- Keyword research
- Link buildings
- Content creation
In keyword research, we use tools Ahrefs and Ubersuggest and analyze every Keyword Volume, Global Volume, Keyword difficulty, Paid difficulty, Cost per Click, Competitors. Also, we check the combination of the keyword in some phrases, questions, and comparisons solutions.
Short brief about metrics (skip to the next paragraph if you are familiar with those):
Volume – an estimation of the average monthly number of searches for a keyword.
Global volume – shows how many times per month, on average, people search for the target keyword across all countries.
Keyword difficulty – the higher the number, the more competitive the keyword is. Thus, it is harder to rank in the top 10 organic search results for the keyword.
Cost per Click – average cost per click on this keyword in Google Ads.
Competitors – watching how strong are other websites which already position for this keyword.
For example, at Async Labs, as it is a software development and digital agency, our primary backend technologies are PHP and NodeJS. Still, we are open to using other technologies. This gained us to write an article on how to choose the right technology for developing an app.
Keyword research by all listed above metrics resulted that our focus keyword is backend technologies. You can check the whole article with an infographic included on the link.
With link buildings, there are different approaches. In the context of blog post articles, we have internal link buildings that are hyperlinks from one page of our site that direct the reader to another page on our site.
On another side, we added external links through the blog post section. They link outside of our webpage and help us improve the credibility of the website. You will find them in any article in our Blog posts.
For content creation, if we take a look at our monthly traffic, in September 2020, we had 4 342 Page Views. One year later, in September 2021, we had 13 547 Page Views.
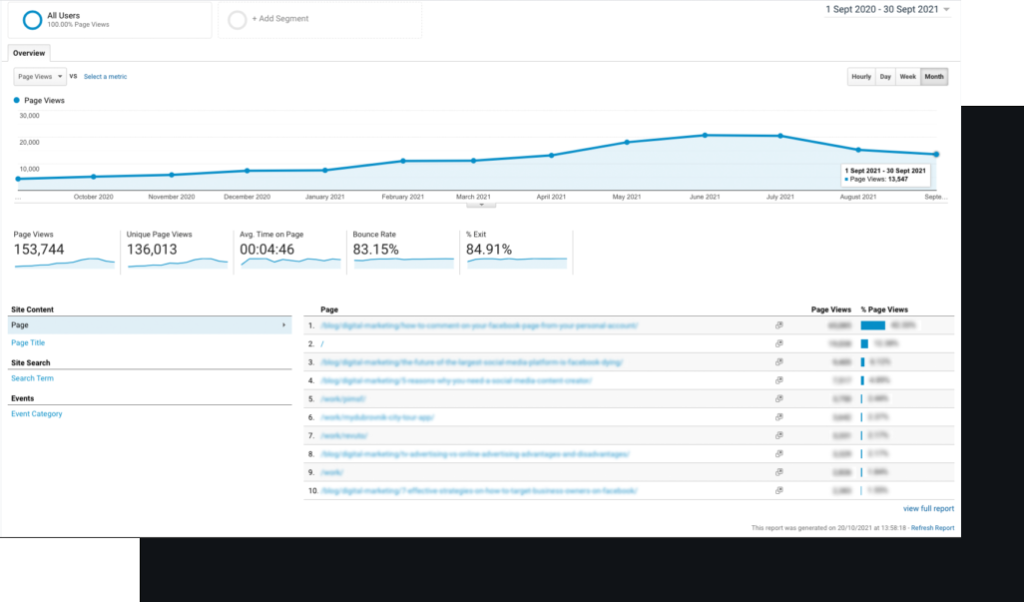
With all listed above, our content is now on level up if we compare it to the previous year (and previous website). Plus, we had given special attention to Design in our blog posts articles.
For each article, we prepared custom visuals from covers, illustrations, infographics, etc. In the end, our Goal for 2021 is to gain 2.5 million impressions.
What do you think; are we going to succeed in accomplishing our Goal?
Doubling the number of leads
While developing the website, we wanted to create a modern website with intuitive navigation for users to acquire more leads.
One year after the new website launch, if we look at the number of leads in September 2020 vs. September 2021, we increased leads by 100%. That means we have doubled the number of leads from the previous year. You can understand why we can’t speak here with direct numbers.
We use Pipedrive to boost productivity and performance with leads.
Meanwhile, with the proper Google Analytics setup, we follow how successful each channel and campaign is to generate more quality leads.
Were all those results just of the new website launch?
The simple answer is no. A new website helped us get one step higher, but all this was hard work, from marketing strategy and gaining campaigns in the same direction. These are results of brand awareness presence and five-year existence on the market.
A new website launch helped us on our never-ending journey as there will always be space for better functionalities, an advanced lead funnel, and new features. As long as all this leads to our goals, this investment was cost-effective.
A special thank you goes to the great team of our Async Labs people who have made this happen and are ready to invest their knowledge to achieve these results.
PS: If you want to see how our previous website looks, drop us a line through our contact form, and we will send it to you. You will see the difference and understand why we say, “now we are one step higher”. 🙂
